
Nexters Inc. Analyst EPS Estimates
| Quarter | Number of Estimates | Low Estimate | High Estimate | Average Estimate |
|---|---|---|---|---|
| Q1 2024 | 0 | $0.00 | $0.00 | $0.00 |
| Q1 2025 | 0 | $0.00 | $0.00 | $0.00 |
Nexters Inc. Earnings Date And Information
Nexters Inc. last posted its earnings results on N/A. The company reported $N/A earnings per share for the quarter, missing analysts' consensus estimates of $N/A by $0. The company had revenue of 105.82 M for the quarter and had revenue of 464.55 M for the year. Nexters Inc. has generated $2 earnings per share over the last year ($2.3 diluted earnings per share) and currently has a price-to-earnings ratio of 9.3. Nexters Inc. has not formally confirmed its next earnings publication date, but the company's estimated earnings date is N/A based on prior year's report dates.
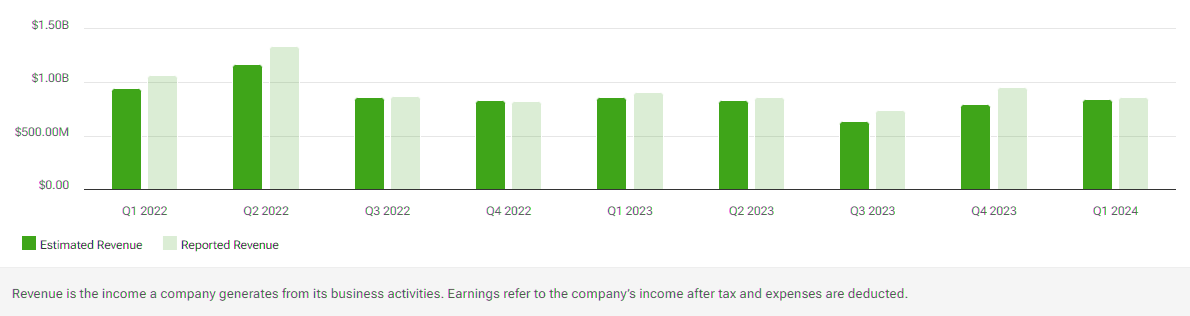
Nexters Inc. Earnings History by Quarter
| Date | Quarter | Consensus Estimate | Reported EPS | Beat/Miss | Revenue Estimate | Actual Revenue |
|---|---|---|---|---|---|---|
| 06/29/2024 | Q2 2024 | $0.81 | $105.82 M | |||
| 03/29/2024 | Q1 2024 | -$0.05 | $107.00 M | |||
| 04/29/2024 | Q4 2023 | $0.56 | $109.12 M | |||
| 09/29/2023 | Q3 2023 | $1.20 | $121.30 M | |||
| 09/29/2023 | Q2 2023 | $1.03 | $114.86 M | |||
| 09/29/2023 | Q1 2023 | -$0.41 | $119.28 M | |||
| 06/26/2023 | Q4 2022 | -$5.09 | $103.05 M | |||
| 09/30/2022 | Q3 2022 | $1.60 | $124.80 M | |||
| 06/30/2022 | Q2 2022 | $2.06 | $125.77 M | |||
| 03/31/2022 | Q1 2022 | $1.20 | $126.07 M | |||
| 04/29/2022 | Q4 2021 | $0.92 | $122.58 M | |||
| 09/30/2021 | Q3 2021 | -$5.87 | $115.18 M | |||
| 06/30/2021 | Q2 2021 | -$1.02 | $109.64 M | |||
| 03/31/2021 | Q1 2021 | -$0.60 | $86.69 M | |||
| 12/31/2020 | Q4 2020 | $0.32 | $74.36 M | |||
| 09/30/2020 | Q3 2020 | -$0.57 | $64.50 M | |||
| 06/30/2020 | Q2 2020 | $0.53 | $63.26 M | |||
| 03/31/2020 | Q1 2020 | -$0.32 | $58.78 M |
Nexters Inc. Earnings: Frequently Asked Questions
-
How can I listen to Nexters Inc.'s earnings conference call?
The conference call for Nexters Inc.'s latest earnings report can be listened to online.
-
How can I read Nexters Inc.'s conference call transcript?
The conference call transcript for Nexters Inc.'s latest earnings report can be read online.
-
How much revenue does Nexters Inc. generate each year?
Nexters Inc. (:GDEVW) has a recorded annual revenue of $464.55 M.
-
How much profit does Nexters Inc. generate each year?
Nexters Inc. (:GDEVW) has a recorded net income of $464.55 M. Nexters Inc. has generated $2.3 earnings per share over the last four quarters.
-
What is Nexters Inc.'s price-to-earnings ratio?
Nexters Inc. (:GDEVW) has a price-to-earnings ratio of 9.3 and price/earnings-to-growth ratio is -1.26.