American Oncology Network, Inc. Earnings History by Quarter
| Date | Quarter | Consensus Estimate | Reported EPS | Beat/Miss | Revenue Estimate | Actual Revenue |
|---|---|---|---|---|---|---|
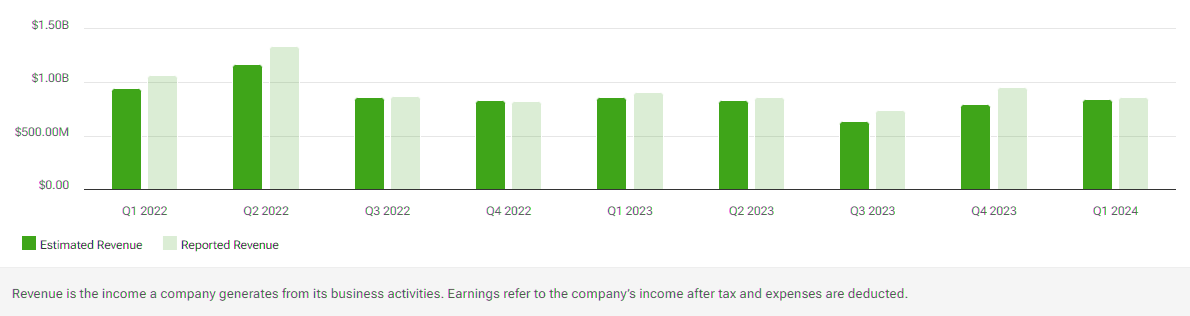
| 08/14/2024 | Q2 2024 | $0.12 | $433.98 M | |||
| 03/30/2024 | Q1 2024 | -$1.04 | $364.34 M | |||
| 12/30/2023 | Q4 2023 | -$0.56 | $324.18 M | |||
| 09/29/2023 | Q3 2023 | -$0.27 | $336.31 M | |||
| 06/28/2023 | Q2 2023 | -$0.17 | $314.97 M | |||
| 05/12/2023 | Q1 2023 | $0.01 | $303.73 M | |||
| 12/30/2022 | Q4 2022 | $252.83 | $300.40 M | |||
| 09/29/2022 | Q3 2022 | $0.36 | $297.32 M | |||
| 08/12/2022 | Q2 2022 | $0.04 | $0 | |||
| 05/17/2022 | Q1 2022 | $0.08 | $0 | |||
| 04/13/2022 | Q4 2021 | -$0.01 | $0 | |||
| 11/19/2021 | Q3 2021 | $0.08 | $0 | |||
| 08/24/2021 | Q2 2021 | $0.20 | $0 | |||
| 03/30/2021 | Q1 2021 | -$0.01 | $0 |
American Oncology Network, Inc. Earnings: Frequently Asked Questions
-
How can I listen to American Oncology Network, Inc.'s earnings conference call?
The conference call for American Oncology Network, Inc.'s latest earnings report can be listened to online.
-
How can I read American Oncology Network, Inc.'s conference call transcript?
The conference call transcript for American Oncology Network, Inc.'s latest earnings report can be read online.
-
How much revenue does American Oncology Network, Inc. generate each year?
American Oncology Network, Inc. (:AONC) has a recorded annual revenue of $1.28 B.
-
How much profit does American Oncology Network, Inc. generate each year?
American Oncology Network, Inc. (:AONC) has a recorded net income of $1.28 B. American Oncology Network, Inc. has generated $-0.83 earnings per share over the last four quarters.
-
What is American Oncology Network, Inc.'s price-to-earnings ratio?
American Oncology Network, Inc. (:AONC) has a price-to-earnings ratio of -3.85 and price/earnings-to-growth ratio is -0.18.