
Vector Group Ltd. Analyst EPS Estimates
| Quarter | Number of Estimates | Low Estimate | High Estimate | Average Estimate |
|---|---|---|---|---|
| Q1 2024 | 0 | $0.25 | $0.25 | $0.25 |
| Q2 2024 | 0 | $0.30 | $0.30 | $0.30 |
| Q3 2024 | 1 | $0.37 | $0.37 | $0.37 |
| Q4 2024 | 0 | $0.36 | $0.36 | $0.36 |
Vector Group Ltd. Earnings Date And Information
Vector Group Ltd. last posted its earnings results on Wednesday, July 31st, 2024. The company reported $0.34 earnings per share for the quarter, topping analysts' consensus estimates of $0.3 by $0.04. The company had revenue of 371.91 M for the quarter and had revenue of 1.42 B for the year. Vector Group Ltd. has generated $1 earnings per share over the last year ($1.16 diluted earnings per share) and currently has a price-to-earnings ratio of 11.54. Vector Group Ltd. has not formally confirmed its next earnings publication date, but the company's estimated earnings date is Wednesday, October 30th, 2024 based on prior year's report dates.
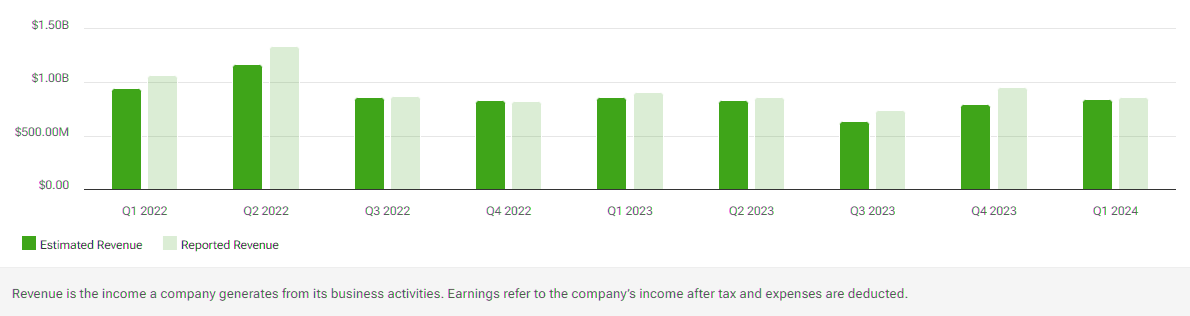
Vector Group Ltd. Earnings History by Quarter
| Date | Quarter | Consensus Estimate | Reported EPS | Beat/Miss | Revenue Estimate | Actual Revenue |
|---|---|---|---|---|---|---|
| 08/02/2024 | Q2 2024 | $0.34 | $362.90 M | $371.91 M | ||
| 05/03/2024 | Q1 2024 | $0.22 | $324.57 M | |||
| 04/29/2024 | Q4 2023 | $0.36 | $360.35 M | |||
| 11/03/2023 | Q3 2023 | $0.33 | $387.50 M | $364.11 M | ||
| 08/04/2023 | Q2 2023 | $0.24 | $408.20 M | $365.66 M | ||
| 05/09/2023 | Q1 2023 | $0.22 | $334.15 M | |||
| 05/01/2023 | Q4 2022 | $0.30 | $363.77 M | |||
| 11/02/2022 | Q3 2022 | $0.25 | $309.10 M | $378.00 M | ||
| 08/05/2022 | Q2 2022 | $0.25 | $387.20 M | |||
| 05/10/2022 | Q1 2022 | $0.25 | $0.21 | -0.04 | $312.04 M | |
| 03/02/2022 | Q4 2021 | $0.29 | $612.20 M | $-705,239,000 | ||
| 11/09/2021 | Q3 2021 | $0.31 | $651.80 M | $298.49 M | ||
| 08/06/2021 | Q2 2021 | $0.60 | $559.30 M | $337.55 M | ||
| 05/06/2021 | Q1 2021 | $0.20 | $270.99 M | |||
| 03/01/2021 | Q4 2020 | $0.21 | $450.00 M | $554.59 M | ||
| 11/06/2020 | Q3 2020 | $0.25 | $432.40 M | $547.83 M | ||
| 08/07/2020 | Q2 2020 | $0.17 | $529.70 M | $445.76 M | ||
| 05/11/2020 | Q1 2020 | -$0.02 | $454.49 M | |||
| 03/02/2020 | Q4 2019 | $0.06 | $451.60 M | $439.57 M | ||
| 11/07/2019 | Q3 2019 | $0.23 | $526.50 M | $504.79 M |
Vector Group Ltd. Earnings: Frequently Asked Questions
-
When is Vector Group Ltd.'s earnings date?
Vector Group Ltd. has not confirmed its next earnings publication date, but the company's estimated earnings date is Wednesday, October 30th, 2024 based off last year's report dates.
-
Did Vector Group Ltd. beat their earnings estimates last quarter?
In the previous quarter, Vector Group Ltd. (:VGR) reported $0.34 earnings per share (EPS) to beat the analysts' consensus estimate of $0.3 by $0.04.
-
How can I listen to Vector Group Ltd.'s earnings conference call?
The conference call for Vector Group Ltd.'s latest earnings report can be listened to online.
-
How can I read Vector Group Ltd.'s conference call transcript?
The conference call transcript for Vector Group Ltd.'s latest earnings report can be read online.
-
How much revenue does Vector Group Ltd. generate each year?
Vector Group Ltd. (:VGR) has a recorded annual revenue of $1.42 B.
-
How much profit does Vector Group Ltd. generate each year?
Vector Group Ltd. (:VGR) has a recorded net income of $1.42 B. Vector Group Ltd. has generated $1.17 earnings per share over the last four quarters.
-
What is Vector Group Ltd.'s price-to-earnings ratio?
Vector Group Ltd. (:VGR) has a price-to-earnings ratio of 11.54 and price/earnings-to-growth ratio is 0.73.