
Denbury Inc. Analyst EPS Estimates
| Quarter | Number of Estimates | Low Estimate | High Estimate | Average Estimate |
|---|---|---|---|---|
| Q1 2024 | 3 | $1.39 | $1.74 | $1.58 |
| Q2 2024 | 3 | $1.18 | $1.48 | $1.34 |
| Q3 2024 | 3 | $1.36 | $1.70 | $1.54 |
Denbury Inc. Earnings Date And Information
Denbury Inc. last posted its earnings results on Thursday, November 2nd, 2023. The company reported $1.9 earnings per share for the quarter, topping analysts' consensus estimates of $1.48 by $0.42. The company had revenue of 355.25 M for the quarter and had revenue of 1.70 B for the year. Denbury Inc. has generated $9 earnings per share over the last year ($8.83 diluted earnings per share) and currently has a price-to-earnings ratio of 72.18. Denbury Inc. has not formally confirmed its next earnings publication date, but the company's estimated earnings date is N/A based on prior year's report dates.
Denbury Inc. Earnings History by Quarter
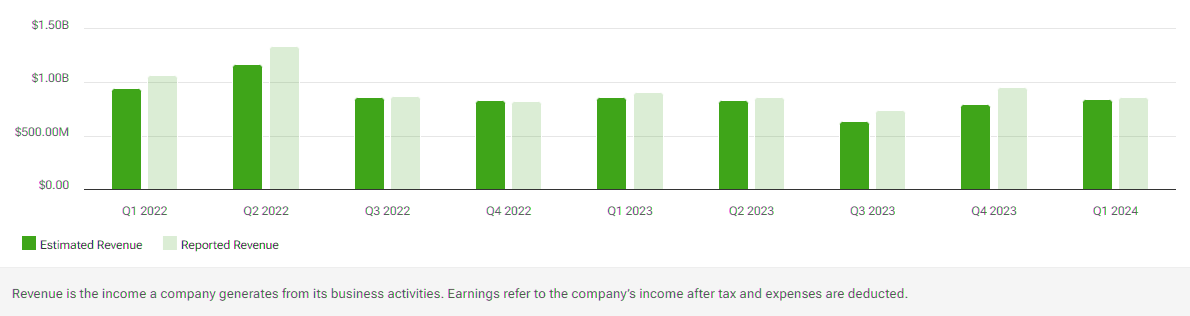
| Date | Quarter | Consensus Estimate | Reported EPS | Beat/Miss | Revenue Estimate | Actual Revenue |
|---|---|---|---|---|---|---|
| 11/21/2023 | Q3 2023 | -$0.06 | $362.23 M | $355.25 M | ||
| 08/03/2023 | Q2 2023 | $1.30 | $399.81 M | $328.09 M | ||
| 05/04/2023 | Q1 2023 | $1.73 | $339.72 M | |||
| 02/23/2023 | Q4 2022 | $1.64 | $1.47 | -0.17 | $379.90 M | |
| 11/03/2022 | Q3 2022 | $1.73 | $4.89 | 3.16 | $336.24 M | $431.47 M |
| 08/04/2022 | Q2 2022 | $1.72 | $2.83 | 1.11 | $427.60 M | $481.37 M |
| 05/06/2022 | Q1 2022 | -$0.02 | $411.61 M | |||
| 02/24/2022 | Q4 2021 | $2.35 | $358.13 M | |||
| 11/04/2021 | Q3 2021 | $0.59 | $1.62 | 1.03 | $349.90 M | $333.28 M |
| 08/05/2021 | Q2 2021 | $0.49 | -$1.52 | -2.01 | $301.37 M | $300.66 M |
| 05/06/2021 | Q1 2021 | $0.28 | -$1.38 | -1.66 | $250.80 M | |
| 03/05/2021 | Q4 2020 | -$1.07 | $192.46 M | |||
| 11/16/2020 | Q3 2020 | -$1.63 | $162.94 M | |||
| 08/11/2020 | Q2 2020 | -$0.04 | -$1.41 | -1.37 | $108.94 M | $117.38 M |
| 05/18/2020 | Q1 2020 | $0.03 | $0.15 | 0.13 | $241.37 M | |
| 02/26/2020 | Q4 2019 | $0.05 | $308.36 M | |||
| 11/07/2019 | Q3 2019 | $0.16 | $263.69 M | $307.64 M | ||
| 08/09/2019 | Q2 2019 | $0.32 | $238.70 M | $341.00 M | ||
| 05/09/2019 | Q1 2019 | -$0.06 | $303.15 M | |||
| 03/01/2019 | Q4 2018 | $0.39 | $336.10 M |
Denbury Inc. Earnings: Frequently Asked Questions
-
Did Denbury Inc. beat their earnings estimates last quarter?
In the previous quarter, Denbury Inc. (:DEN) reported $1.9 earnings per share (EPS) to beat the analysts' consensus estimate of $1.48 by $0.42.
-
How can I listen to Denbury Inc.'s earnings conference call?
The conference call for Denbury Inc.'s latest earnings report can be listened to online.
-
How can I read Denbury Inc.'s conference call transcript?
The conference call transcript for Denbury Inc.'s latest earnings report can be read online.
-
How much revenue does Denbury Inc. generate each year?
Denbury Inc. (:DEN) has a recorded annual revenue of $1.70 B.
-
How much profit does Denbury Inc. generate each year?
Denbury Inc. (:DEN) has a recorded net income of $1.70 B. Denbury Inc. has generated $9.34 earnings per share over the last four quarters.
-
What is Denbury Inc.'s price-to-earnings ratio?
Denbury Inc. (:DEN) has a price-to-earnings ratio of 72.18 and price/earnings-to-growth ratio is -1.37.