HOPE
Income statement / Annual
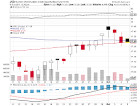
Last year (2025), Hope Bancorp Inc's total revenue was $967.80 M,
a decrease of 3.23% from the previous year.
In 2025, Hope Bancorp Inc's net income was $58.52 M.
See Hope Bancorp Inc,s key income statements, including revenue, expenses, profit, and income.
| Period |
FY-2025
|
FY-2024
|
FY-2023
|
FY-2022
|
FY-2021
|
FY-2020
|
FY-2019
|
FY-2018
|
FY-2017
|
FY-2016
|
| Period Ended |
12/31/2025 |
12/31/2024 |
12/31/2023 |
12/31/2022 |
12/31/2021 |
12/31/2020 |
12/31/2019 |
12/31/2018 |
12/31/2017 |
12/31/2016 |
| Operating Revenue |
$967.80 M |
$1.00 B |
$1.09 B |
$767.51 M |
$610.13 M |
$645.49 M |
$729.49 M |
$707.49 M |
$637.94 M |
$470.80 M |
| Cost of Revenue |
$497.44 M
|
$543.41 M
|
$554.61 M
|
$147.54 M
|
$41.56 M
|
$226.38 M
|
$225.49 M
|
$177.15 M
|
$108.08 M
|
$67.58 M
|
| Gross Profit |
$470.36 M
|
$456.64 M
|
$539.85 M
|
$619.97 M
|
$568.56 M
|
$419.11 M
|
$504.00 M
|
$530.34 M
|
$529.85 M
|
$403.22 M
|
| Gross Profit Ratio |
0.49
|
0.46
|
0.49
|
0.81
|
0.93
|
0.65
|
0.69
|
0.75
|
0.83
|
0.86
|
| Research and Development Expenses |
$0.00
|
$0.00
|
$0.00
|
$0.00
|
$0.00
|
$0.00
|
$0.00
|
$0.00
|
$0.00
|
$0.00
|
| General & Administrative Expenses |
$169.86 M
|
$189.36 M
|
$225.14 M
|
$210.97 M
|
$180.26 M
|
$168.47 M
|
$175.84 M
|
$174.33 M
|
$162.02 M
|
$123.51 M
|
| Selling & Marketing Expenses |
$0.00
|
$0.00
|
$0.00
|
$0.00
|
$0.00
|
$6.28 M
|
$9.15 M
|
$9.41 M
|
$10.28 M
|
$7.32 M
|
| Selling, General & Administrative Expenses |
$169.86 M
|
$189.36 M
|
$225.14 M
|
$210.97 M
|
$180.26 M
|
$174.75 M
|
$184.98 M
|
$183.74 M
|
$172.30 M
|
$130.83 M
|
| Other Expenses |
$219.77 M
|
$134.31 M
|
$136.82 M
|
$112.95 M
|
$113.03 M
|
$102.07 M
|
$92.67 M
|
$91.12 M
|
$93.72 M
|
$81.19 M
|
| Operating Expenses |
$389.62 M
|
$323.68 M
|
$361.96 M
|
$323.92 M
|
$293.29 M
|
$276.82 M
|
$277.65 M
|
$274.86 M
|
$266.02 M
|
$212.02 M
|
| Cost And Expenses |
$887.06 M
|
$867.09 M
|
$916.57 M
|
$471.46 M
|
$334.85 M
|
$503.20 M
|
$503.14 M
|
$452.01 M
|
$374.10 M
|
$279.60 M
|
| Interest Income |
$941.33 M
|
$953.98 M
|
$1.05 B
|
$716.12 M
|
$566.53 M
|
$598.88 M
|
$684.79 M
|
$650.17 M
|
$572.10 M
|
$421.93 M
|
| Interest Expense |
$468.93 M
|
$526.13 M
|
$523.02 M
|
$137.69 M
|
$53.76 M
|
$131.38 M
|
$218.19 M
|
$162.25 M
|
$90.72 M
|
$58.58 M
|
| Depreciation & Amortization |
$2.94 M
|
$0.00
|
$0.00
|
$0.00
|
$0.00
|
$0.00
|
$0.00
|
$0.00
|
-$14.90 M
|
-$1.57 M
|
| EBITDA |
$83.67 M |
$132.96 M |
$177.89 M |
$296.05 M |
$275.27 M |
$142.29 M |
$226.35 M |
$255.48 M |
$248.93 M |
$189.63 M |
| EBITDA Ratio |
0.09
|
0.13
|
0.16
|
0.39
|
0.45
|
0.22
|
0.31
|
0.36
|
0.39
|
0.4
|
| Operating Income Ratio |
0.08
|
0.13
|
0.16
|
0.39
|
0.45
|
0.22
|
0.31
|
0.36
|
0.41
|
0.41
|
| Total Other Income/Expenses Net |
-$7.20 M
|
$0.00
|
$0.00
|
$0.00
|
$0.00
|
$0.00
|
$0.00
|
$0.00
|
$0.00
|
$0.00
|
| Income Before Tax |
$73.53 M
|
$132.96 M
|
$177.89 M
|
$296.05 M
|
$275.27 M
|
$142.29 M
|
$226.35 M
|
$255.48 M
|
$263.83 M
|
$191.20 M
|
| Income Before Tax Ratio |
0.08
|
0.13
|
0.16
|
0.39
|
0.45
|
0.22
|
0.31
|
0.36
|
0.41
|
0.41
|
| Income Tax Expense |
$15.01 M
|
$33.33 M
|
$44.21 M
|
$77.77 M
|
$70.70 M
|
$30.78 M
|
$55.31 M
|
$65.89 M
|
$124.39 M
|
$77.45 M
|
| Net Income |
$58.52 M
|
$99.63 M
|
$133.67 M
|
$218.28 M
|
$204.57 M
|
$111.52 M
|
$171.04 M
|
$189.59 M
|
$139.45 M
|
$113.75 M
|
| Net Income Ratio |
0.06
|
0.1
|
0.12
|
0.28
|
0.34
|
0.17
|
0.23
|
0.27
|
0.22
|
0.24
|
| EPS |
0.46 |
0.83 |
1.11 |
1.82 |
1.67 |
0.9 |
1.35 |
1.44 |
1.03 |
1.1 |
| EPS Diluted |
0.46 |
0.82 |
1.11 |
1.81 |
1.66 |
0.9 |
1.35 |
1.44 |
1.03 |
1.1 |
| Weighted Average Shares Out |
$128.77 M
|
$120.58 M
|
$120.43 M
|
$119.83 M
|
$122.32 M
|
$123.50 M
|
$126.60 M
|
$131.72 M
|
$135.35 M
|
$103.29 M
|
| Weighted Average Shares Out Diluted |
$128.77 M
|
$121.11 M
|
$120.39 M
|
$120.47 M
|
$123.13 M
|
$123.89 M
|
$126.88 M
|
$131.95 M
|
$135.69 M
|
$103.53 M
|
| Link |
|
|
|
|
|
|
|
|
|
|