Buffett Indicator' Screams Danger: Valuations Are Now Higher Than Dot-Com Bubble and 2008 Meltdown
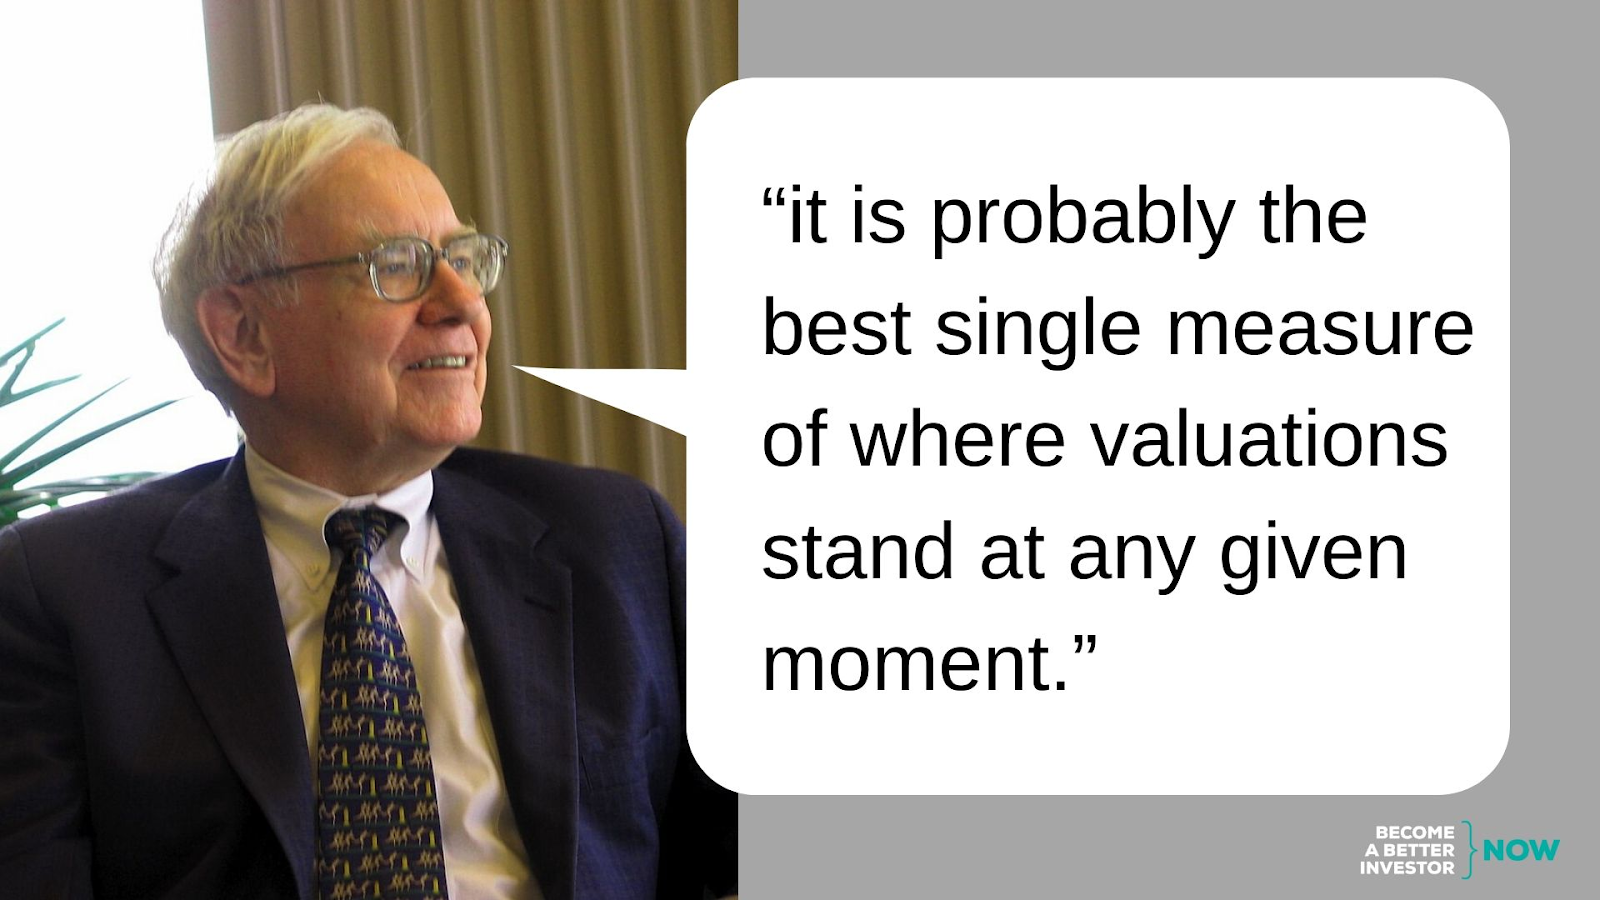
Warren Buffett, the Oracle of Omaha, doesn't need a crystal ball to predict market crashes; he has his trusty market cap-to-GDP ratio, commonly known as the 'Warren Buffett Indicator.'
And guess what? It’s currently flashing redder than my blonde nephew's sunburn, warning us that the stock market is more inflated than the US dollar since Richard Nixon removed us from the gold standard.
(Source: Visual Capitalist)
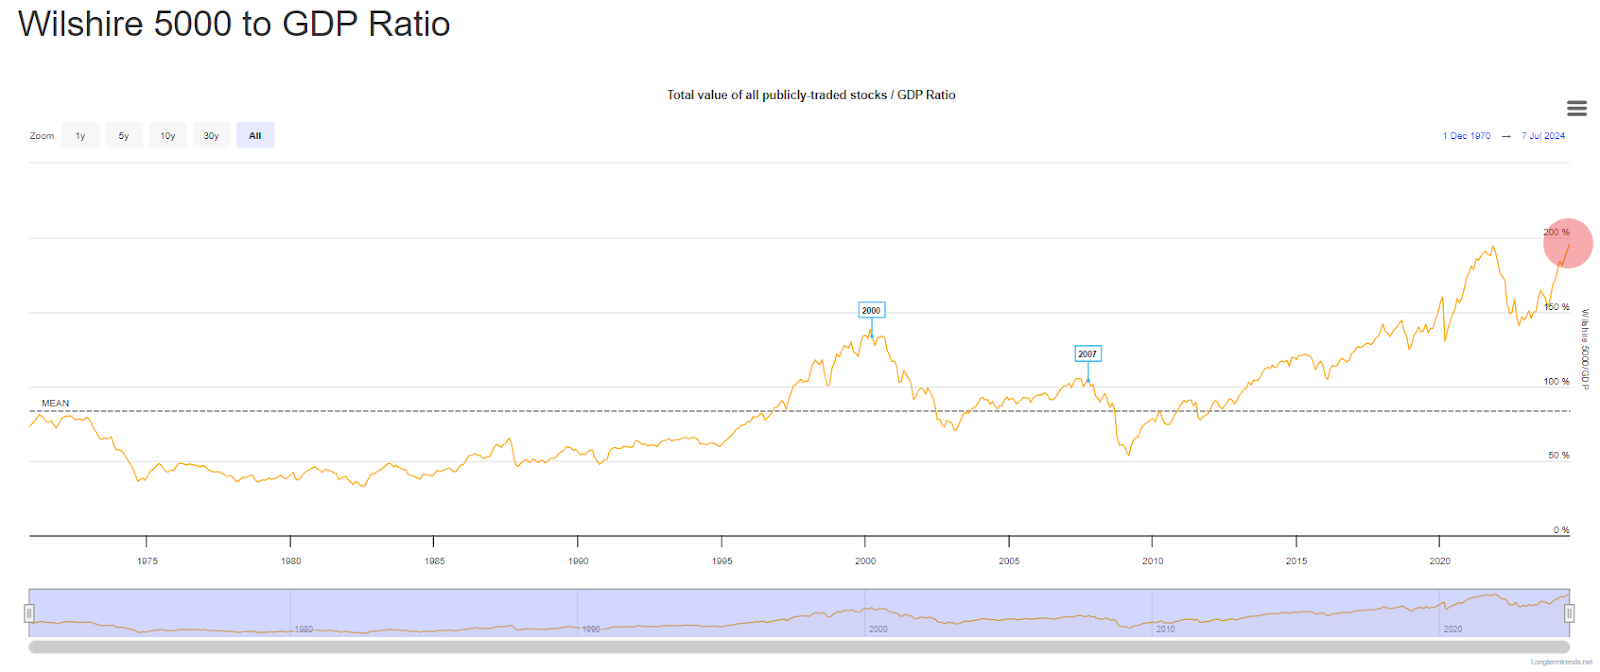
The Buffett Indicator, a ratio of the total market index (tracked by the Wilshire 5000) to the GDP of the U.S., has been sounding the alarm bells. If you didn’t know, the Wilshire 5000 is like the granddaddy of all U.S. stock indices, tracking over 3,000 publicly traded companies.
(Source: Become A Better Investor)
When this ratio spikes, it’s time to pay attention, because historically, high readings have preceded market crashes like the dot-com bubble in 2000 and the Great Financial Crisis of 2008.

Right now, this indicator sits at a jaw-dropping 195%. To put that into perspective, during the dot-com bubble, it was at 140%, and just before the financial meltdown of 2007-2008, it hovered around 110%.
(Source: Barchart)
So, what’s driving this current sky-high ratio? Tech giants like Tesla and NVIDIA are trading at nosebleed valuations with forward P/E ratios above 50, significantly higher than the S&P 500 historical average.
Despite interest rates trying to play the Grinch, mega cap tech companies are basking in the glory of investor optimism, fueled by strong earnings growth projections. I mean seriously, if Jim Cramer is justifying these valuations we’re in big trouble right?
Ryan Detrick, the chief market strategist at Carson Group, points out that forward earnings expectations have been on the rise, which could explain why investors are willing to pay a hefty premium for stocks right now. But as Joe Frazier once said, “the higher they rise, the harder they fall.”
If it seems like you’ve heard this recently, you’re not going crazy. In July 2023, the Buffett Indicator was waving its red flag like a lifeguard at a shark-infested beach, yet the market decided to go boogie boarding anyway and surged by 25% since then, fueled by the AI boom and the ever-optimistic hopes of interest rate cuts.
So this time, will the Buffett Indicator prove ole Warren right with another market crash? Well, that’s the billion-dollar question, isn’t it? If earnings keep growing like a teenager on a fast-food diet, driving GDP higher, we might see the Wilshire 5000 to GDP ratio calm down a bit. But if earnings stumble, brace yourself for a ride bumpier than a taxi ride through New York City.
Buffett himself has said that buying stocks when the ratio is around 200% is like playing with fire. Yet here we are, investors dancing around the flames, hoping not to get burned. As history shows, the market has a way of humbling the overly confident, and the current indicator levels are a stark reminder that we might be on borrowed time.

So, keep an eye on those earnings reports and GDP numbers. The market might be enjoying a wild ride right now, but remember, what goes up must come down every now and then. And when Warren Buffett’s favorite gauge is screaming "danger," it might be wise to at least be aware.

Stock.News has positions in Tesla.